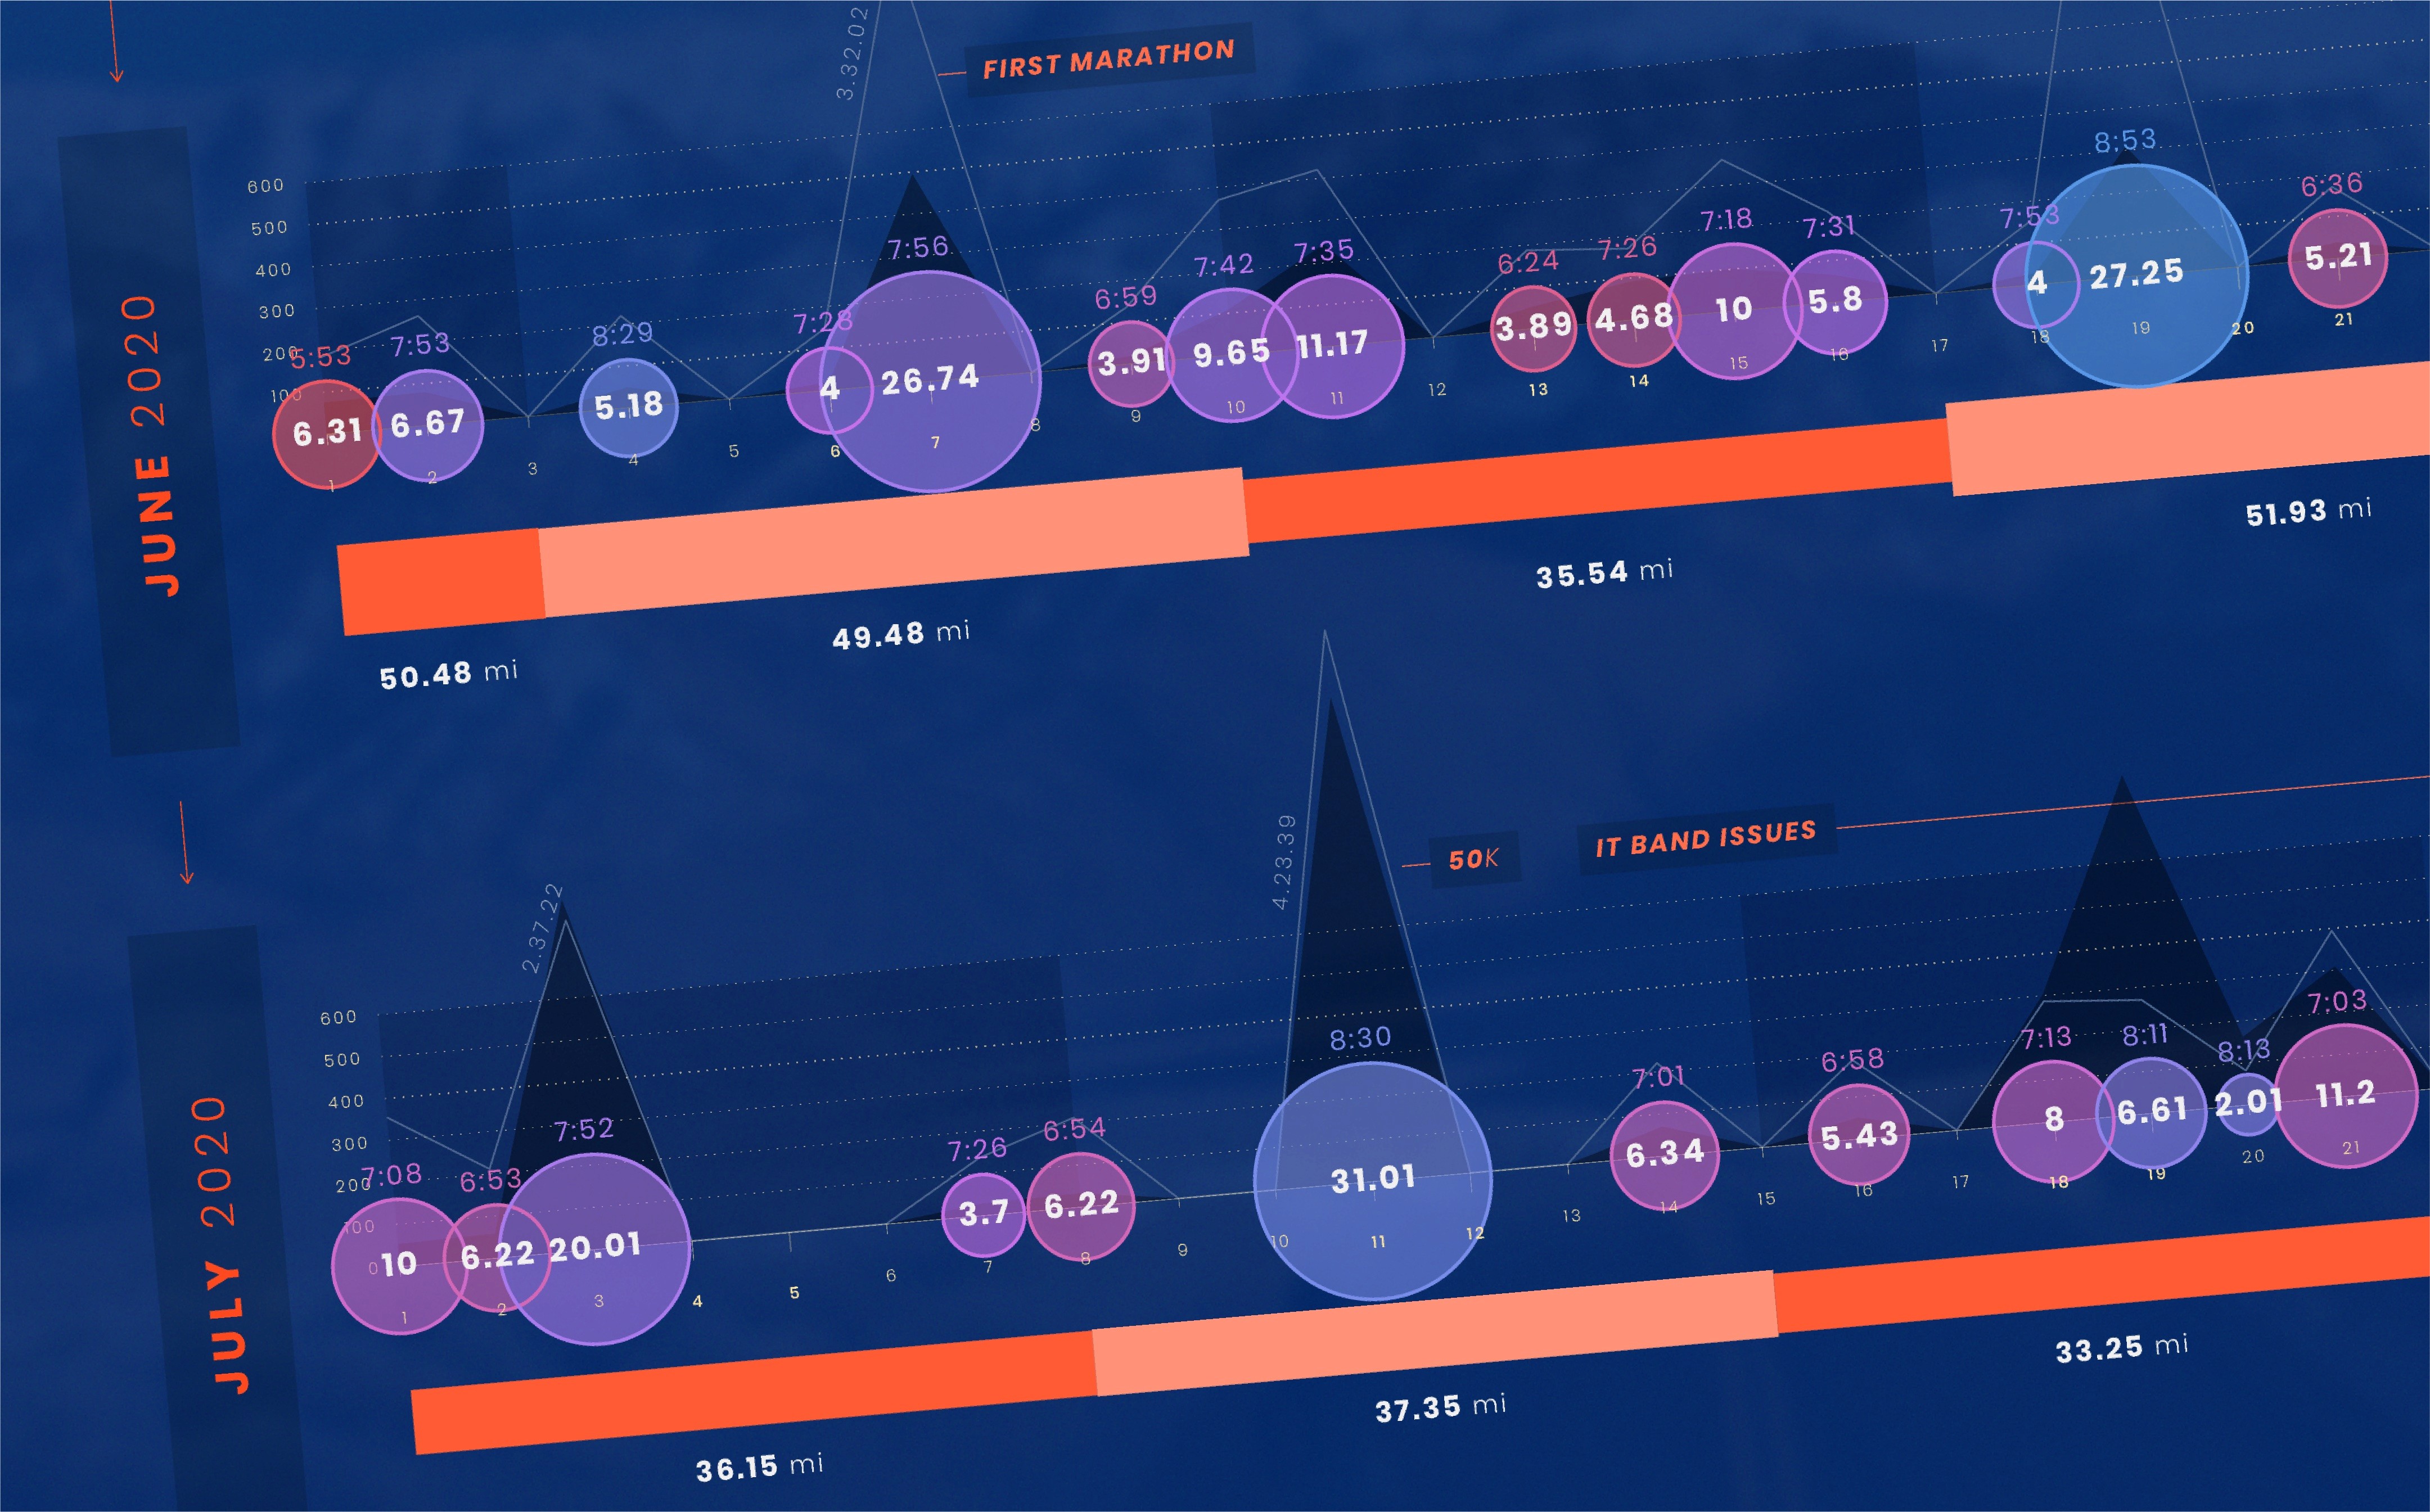
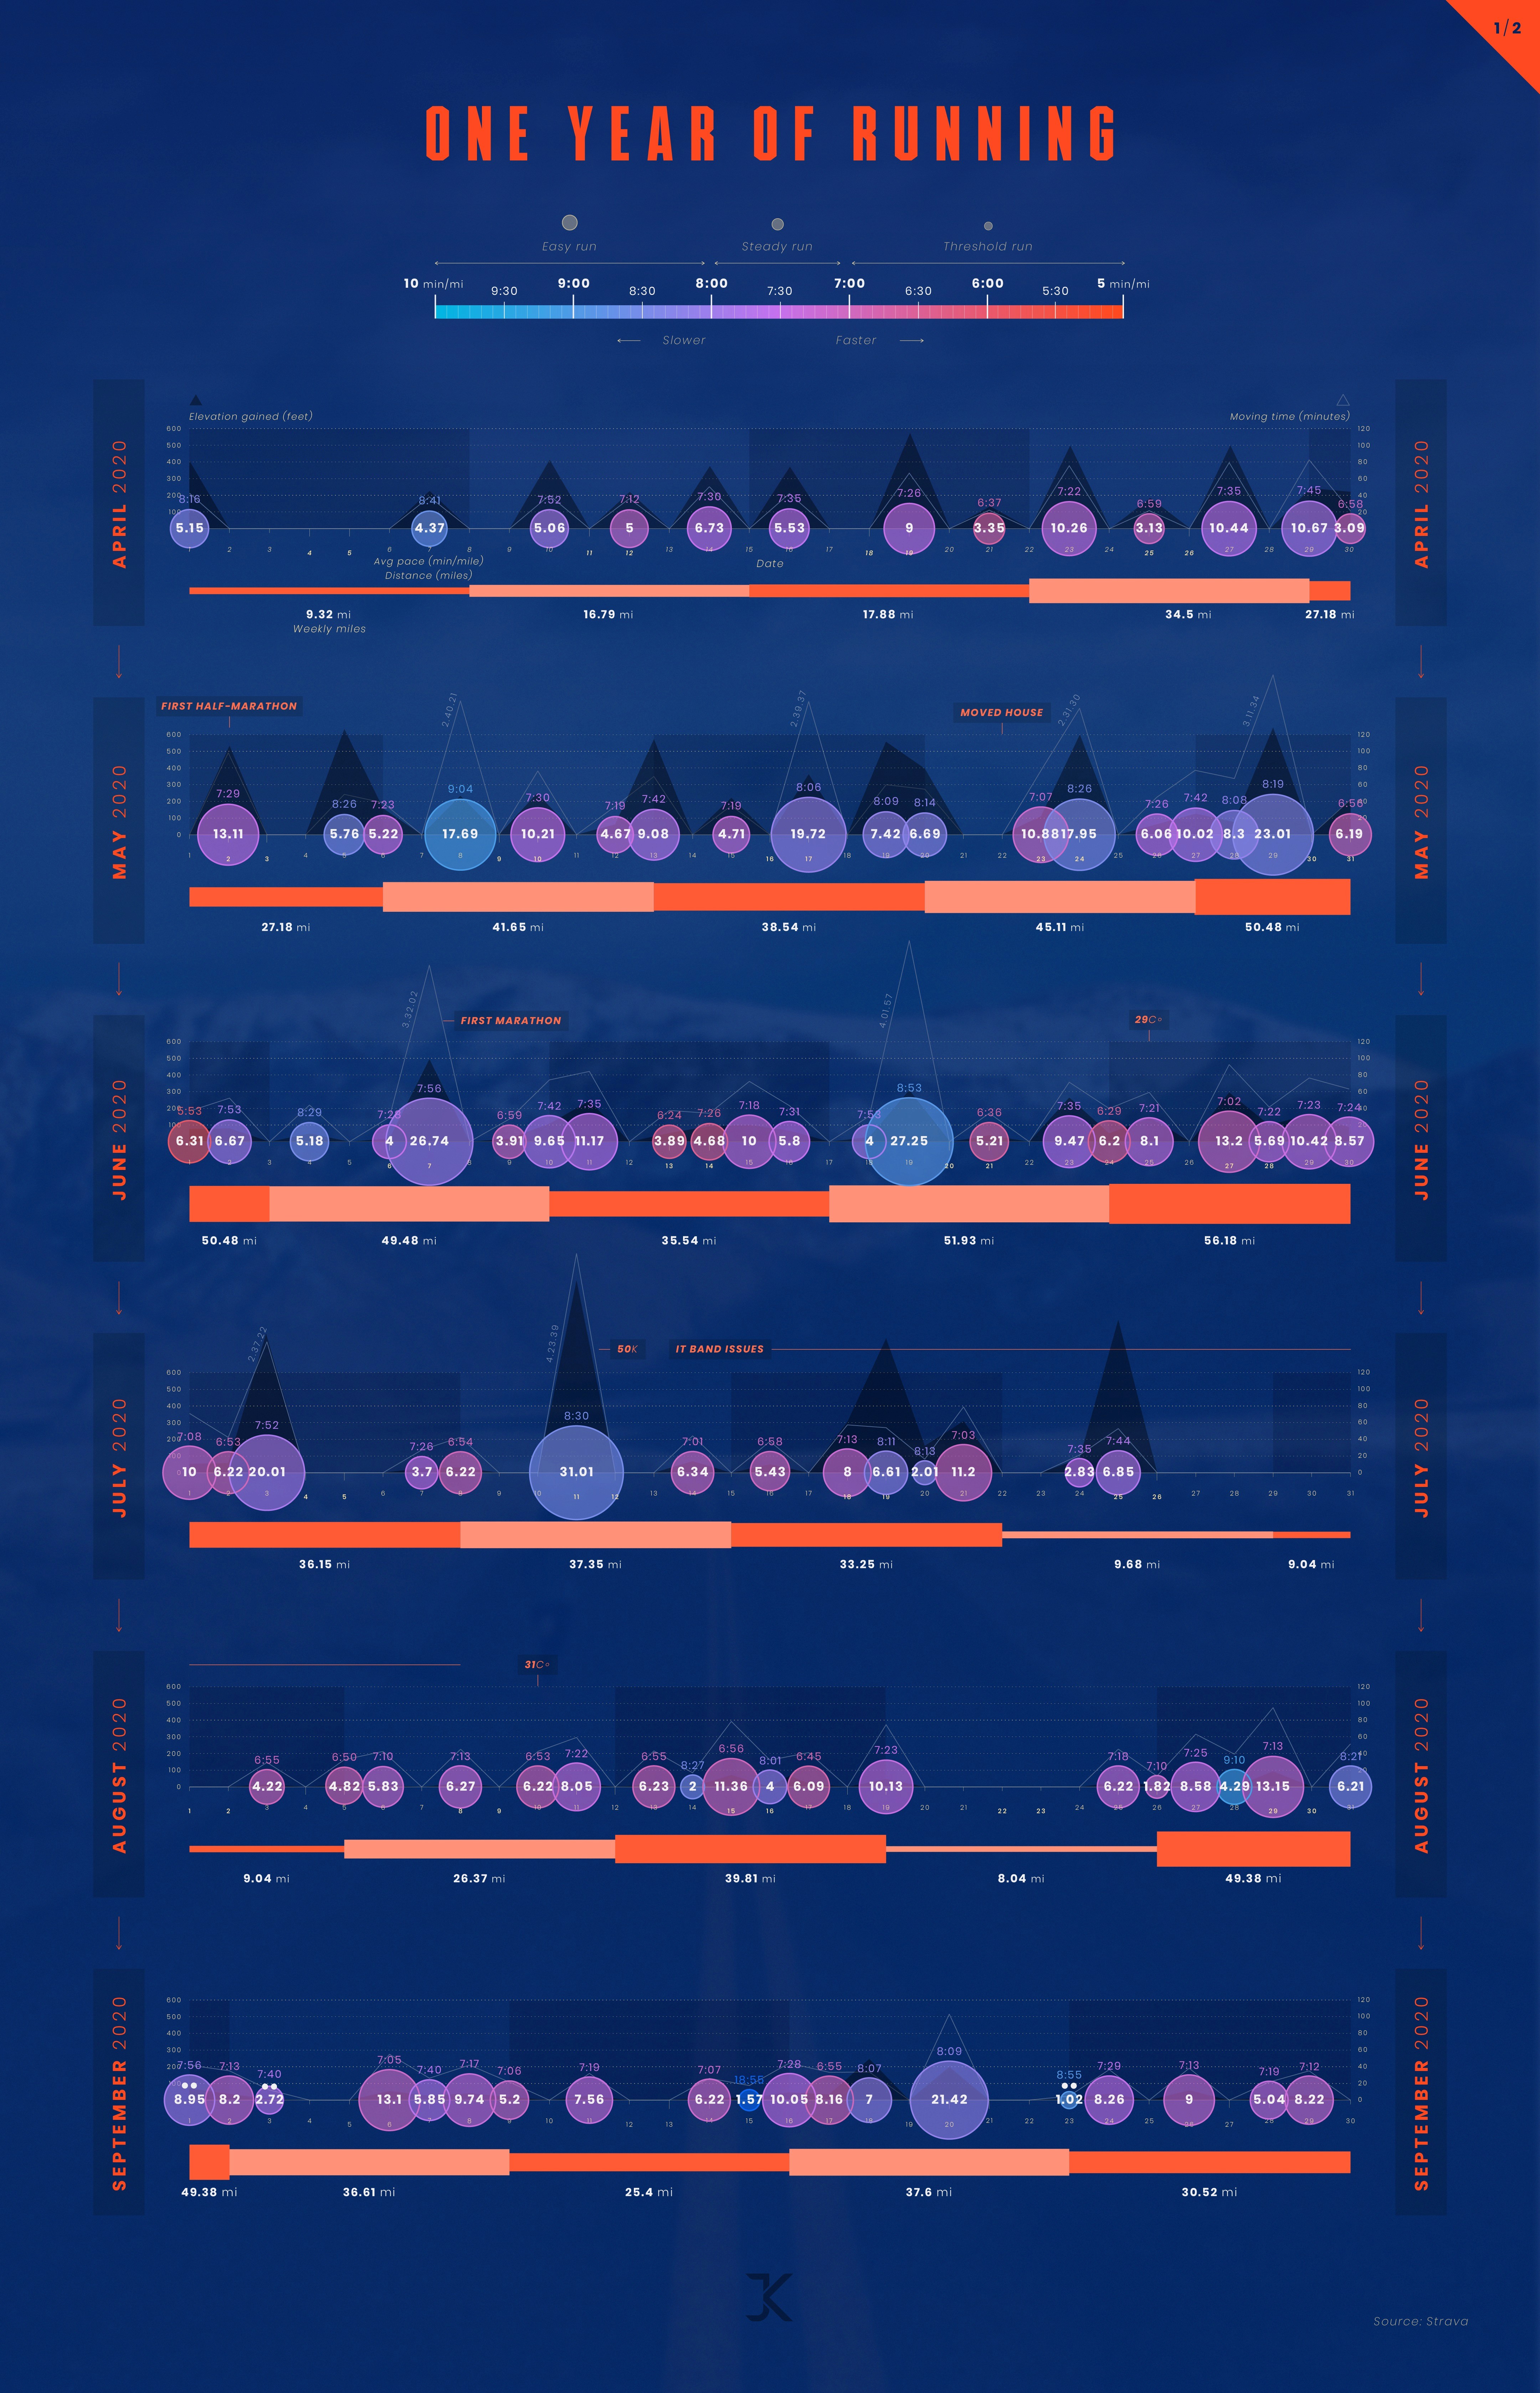
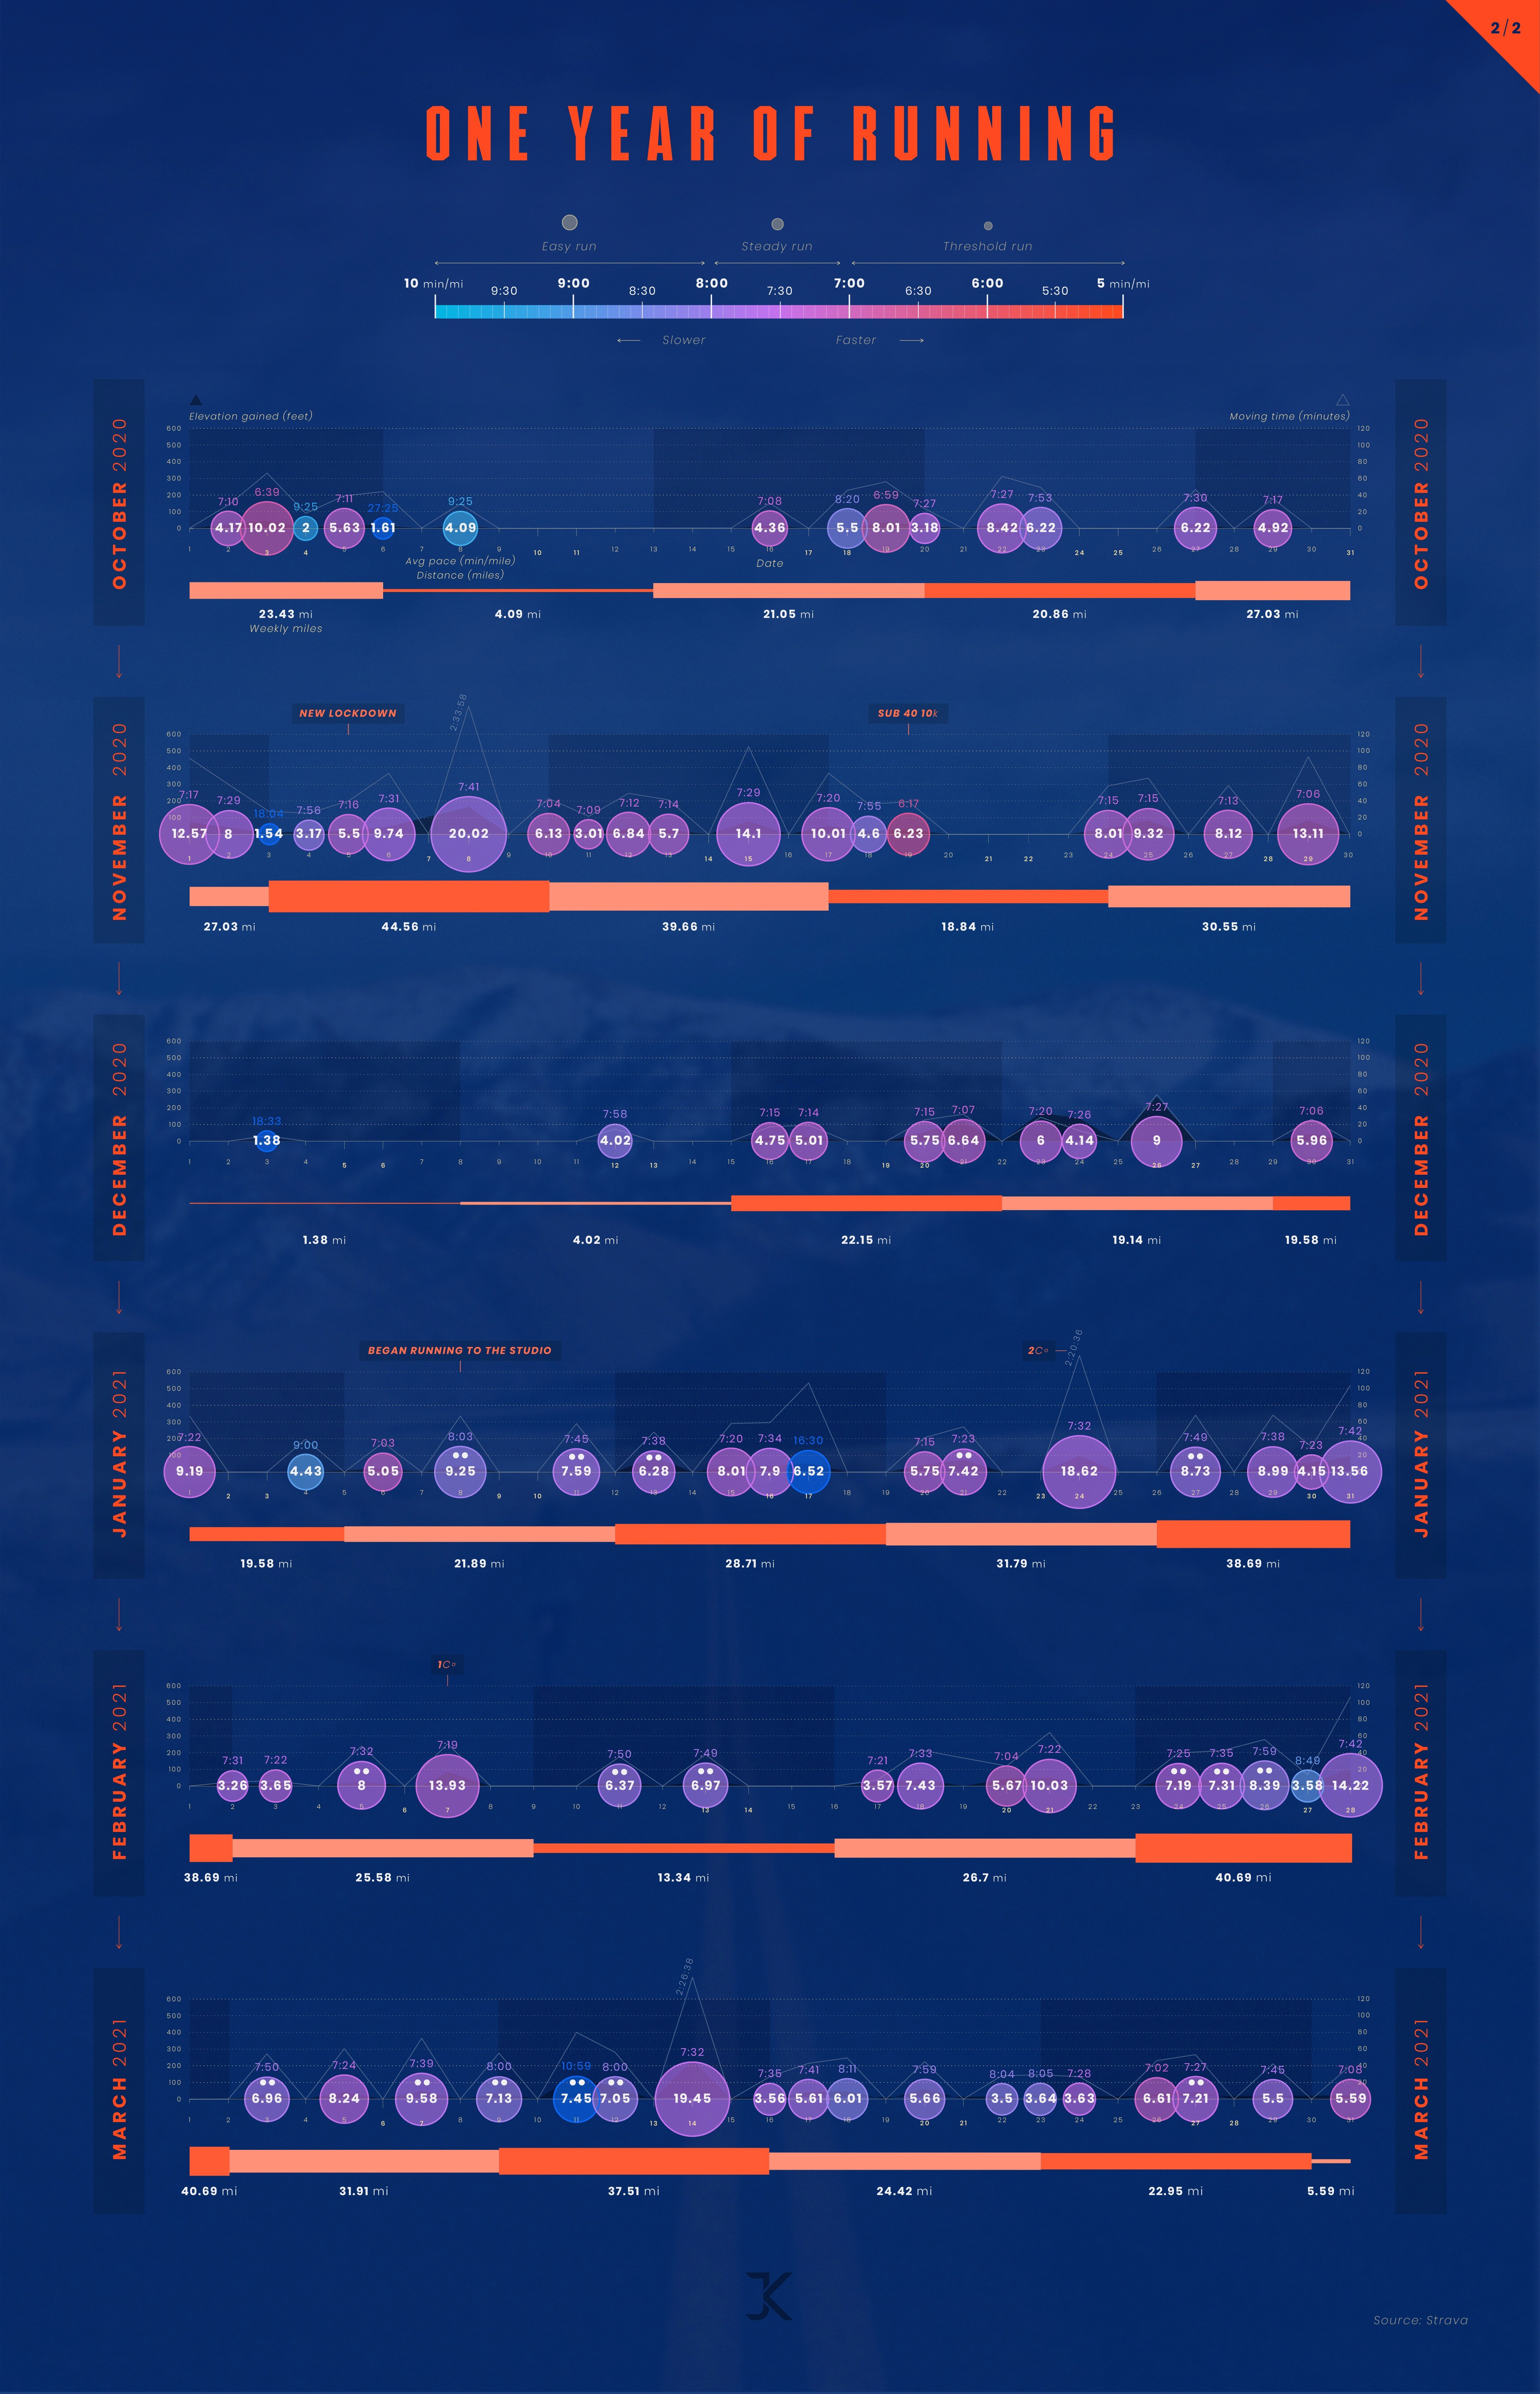
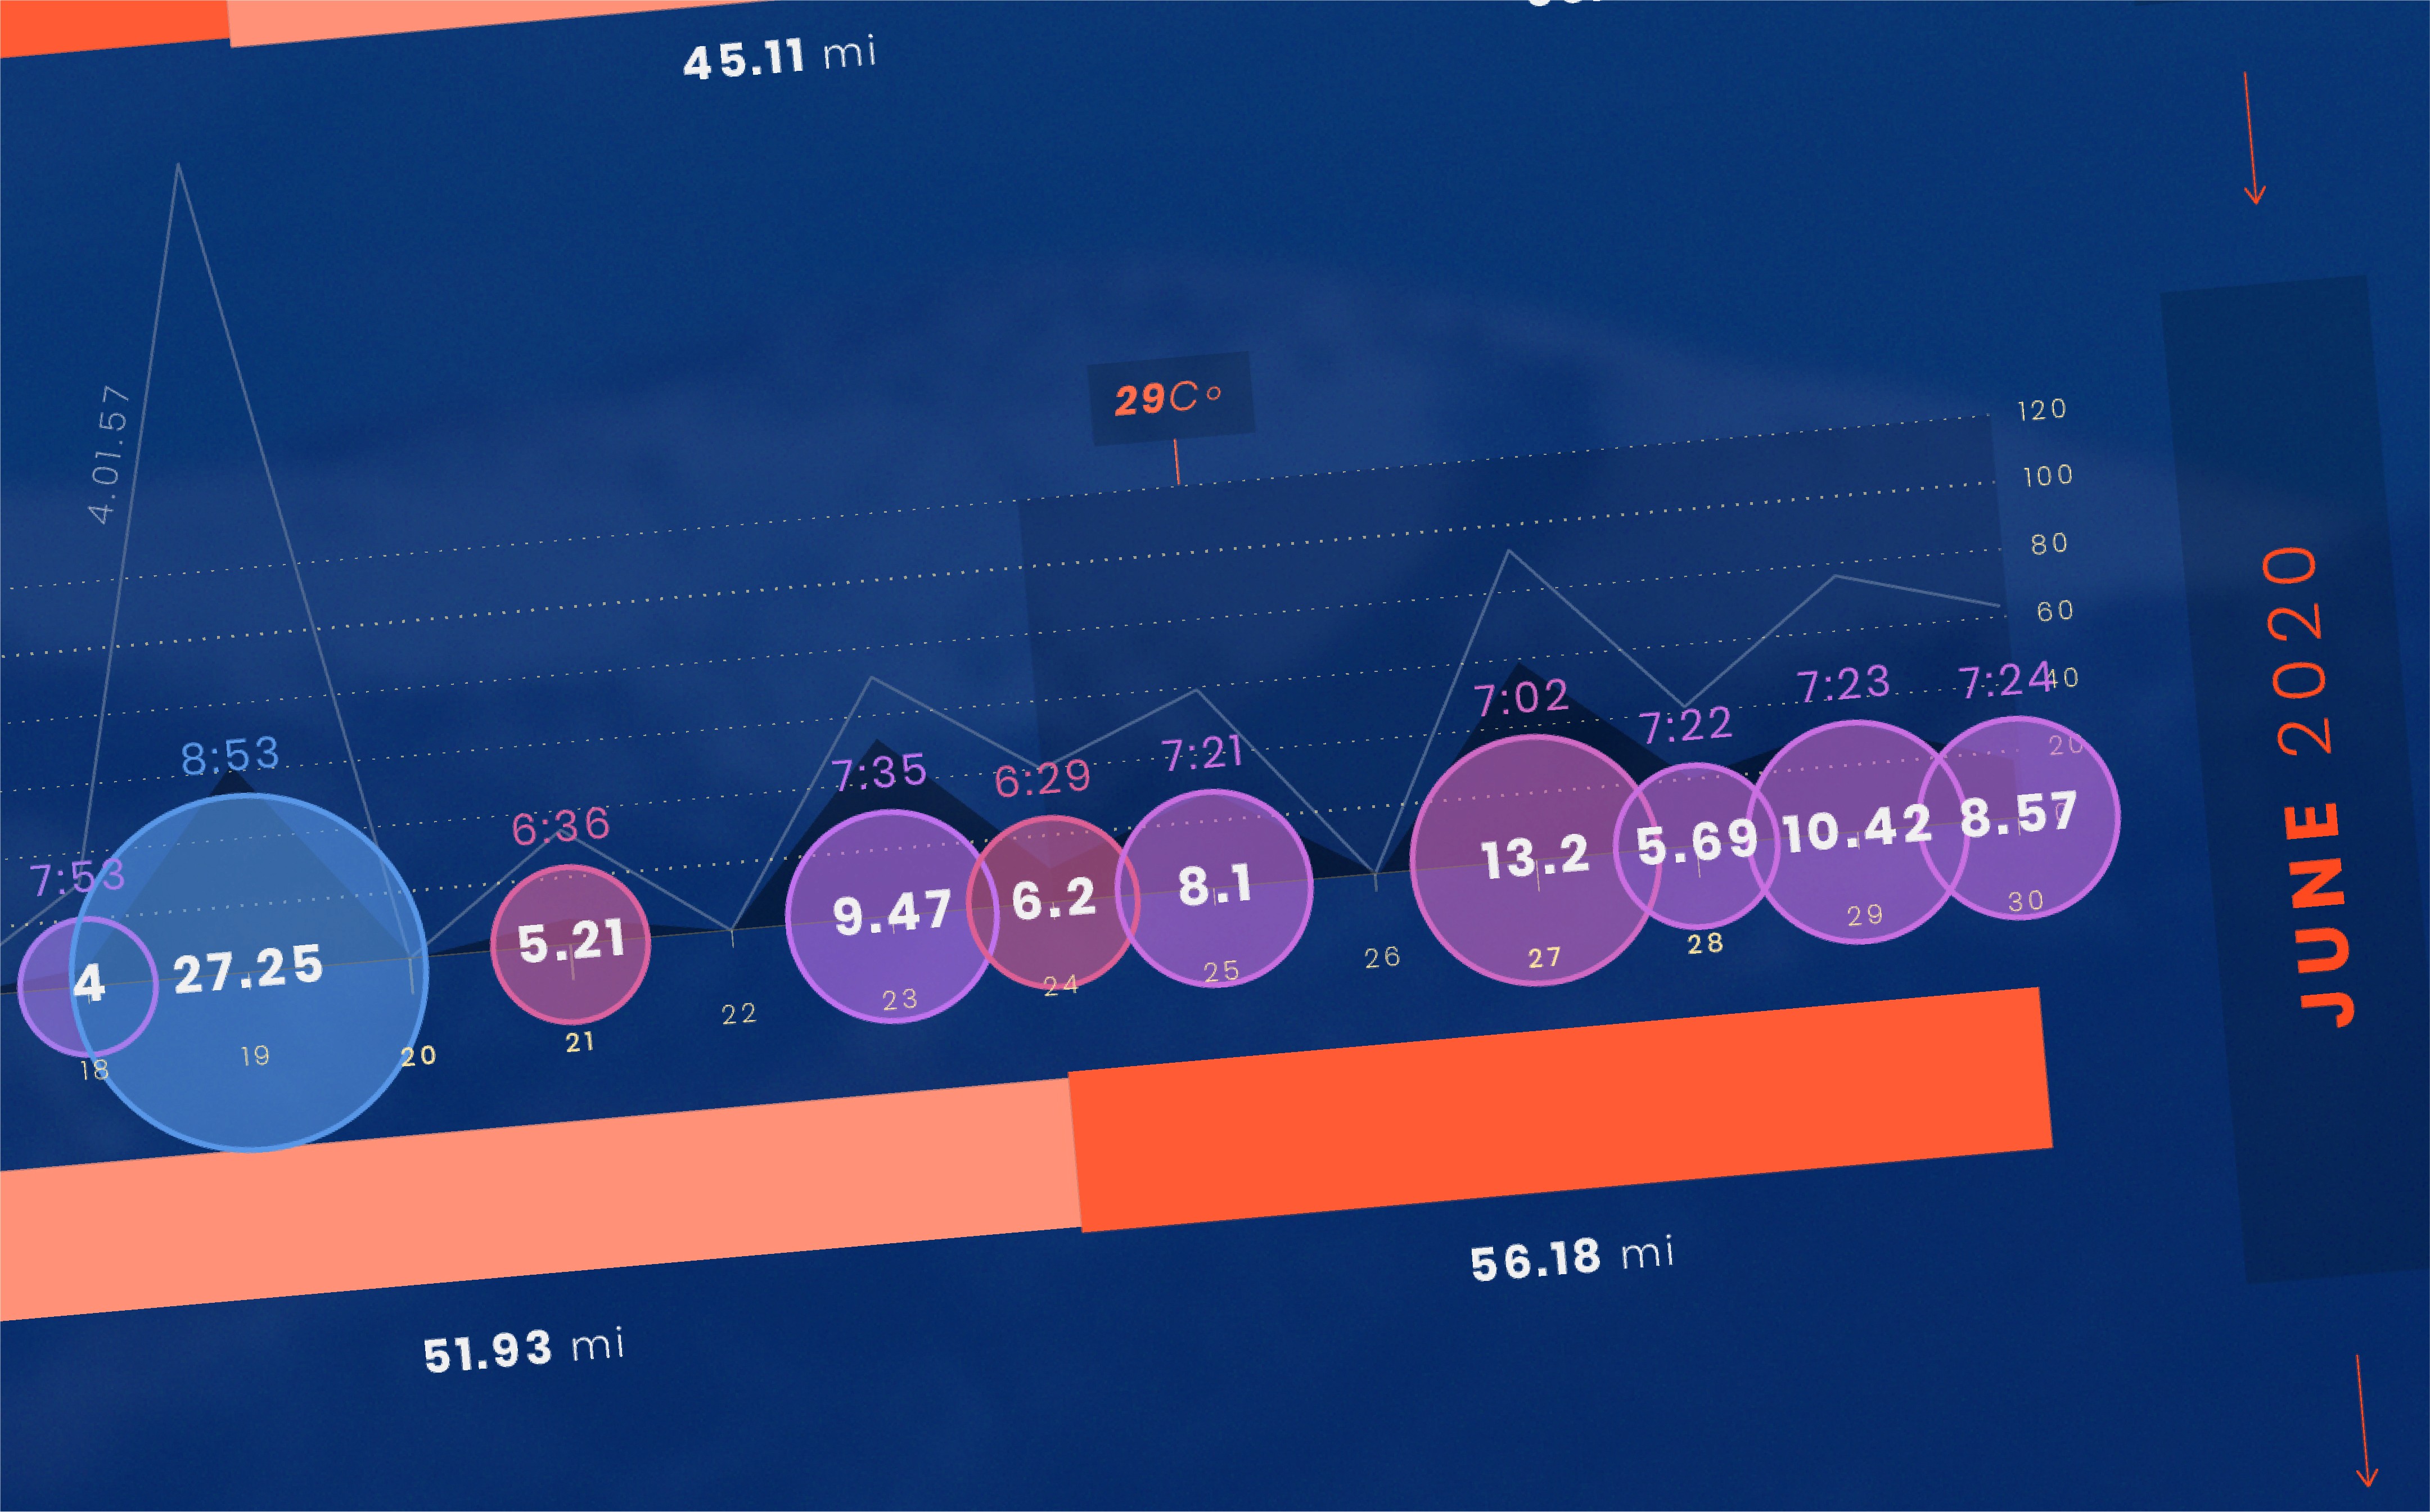
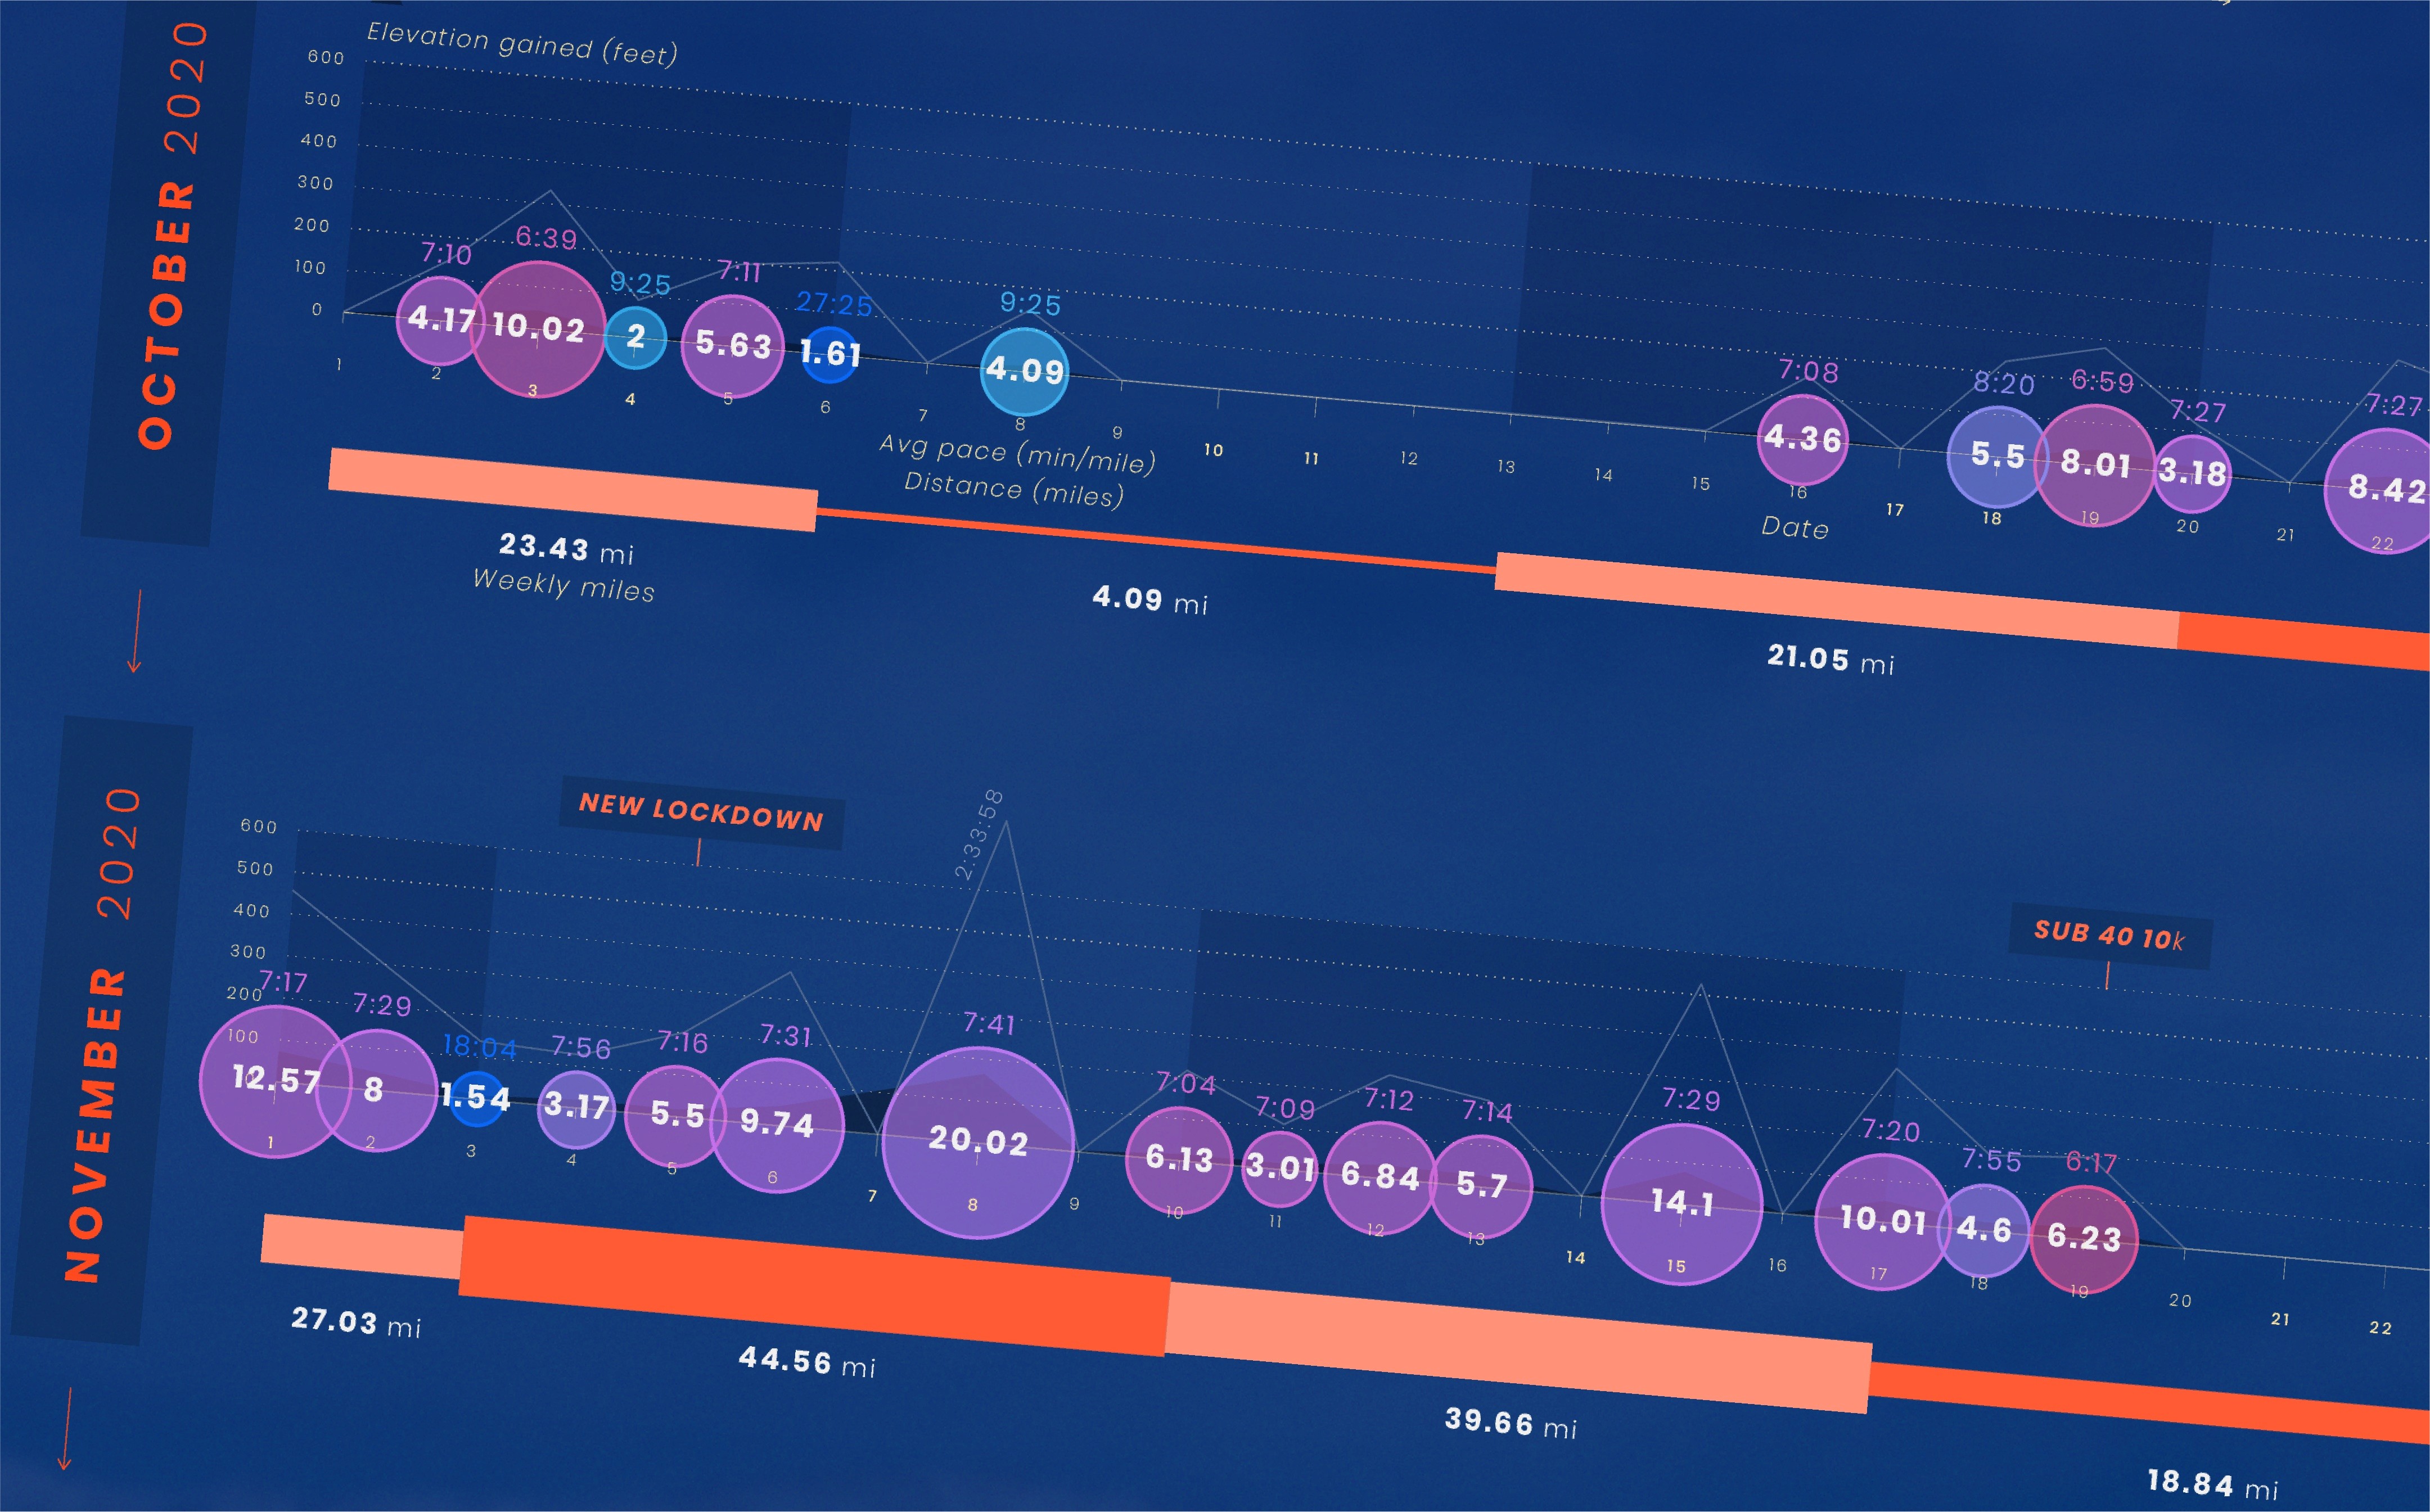
A personal data visualisation project analysing my first year of running. Tracking a full 365 days between 1st April 2020 and 31st March 2021. For every run analysis, there is a breakdown of the distance covered, average pace, elevation gained and moving time. Also, with some added annotations to add context to certain trends of that period.
A personal data visualisation project analysing my first year of running. Tracking a full 365 days between 1st April 2020 and 31st March 2021. For every run analysis, there is a breakdown of the distance covered, average pace, elevation gained and moving time. Also, with some added annotations to add context to certain trends of that period.
© 2023